data(pistonrings)
# 지정된 데이터세트를 load해준다

attach(pistonrings)
# R검색경로에 첨부되어, DB오브젝트에 이름을 지정하여 액세스 가능하게 해준다

diameter = qcc.groups(diameter, sample)
# qcc함수로 데이터를 쉽게 그룹화 해준다
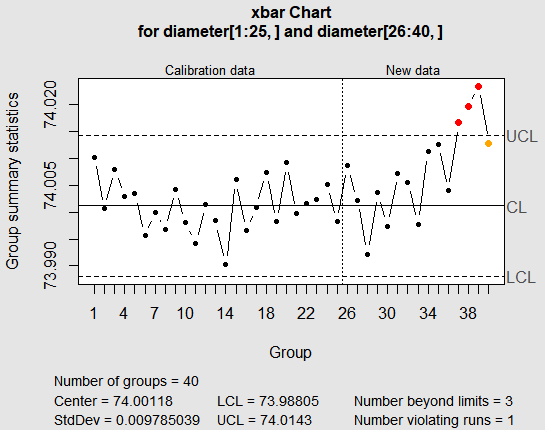
qcc(diameter[1:25,], type = "xbar")
qcc(diameter[1:25,], type = "xbar", newdata = diameter[26:40,])
q = qcc(diameter[1:25,], type = "xbar", newdata = diameter[26:40,],plot=FALSE)
plot(q, chart.all = FALSE)
qcc(diameter[1:25,], type = "xbar", newdata = diameter[26:40,], nsigmas = 2)
qcc(diameter[1:25,], type = "xbar", newdata = diameter[26:40,], confidence.level = 0.99)
qcc(diameter[1:25,], type = "xbar")qcc(diameter[1:25,], type = "xbar", newdata = diameter[26:40,])q = qcc(diameter[1:25,], type = "xbar", newdata = diameter[26:40,],plot=FALSE)qcc(diameter[1:25,], type = "xbar", newdata = diameter[26:40,], nsigmas = 2) qcc(diameter[1:25,], type = "xbar", newdata = diameter[26:40,], confidence.level = 0.99)
qcc(diameter[1:25,], type = "R")
qcc(diameter[1:25,], type = "R", newdata = diameter[26:40,])
qcc(diameter[1:25,], type = "R")qcc(diameter[1:25,], type = "R", newdata = diameter[26:40,])
qcc(diameter[1:25,], type = "S")
qcc(diameter[1:25,], type = "S", newdata = diameter[26:40,])
qcc(diameter[1:25,], type = "S")qcc(diameter[1:25,], type = "S", newdata = diameter[26:40,])
out = c(9,10,30,35,45,64,65,74,75,85,99,100)
diameter = qcc.groups(pistonrings$diameter[-out], sample[-out])
qcc(diameter[1:25,], type = "xbar")
qcc(diameter[1:25,], type = "R")
qcc(diameter[1:25,], type = "S")
qcc(diameter[1:25,], type = "xbar", newdata = diameter[26:40,])
qcc(diameter[1:25,], type = "R", newdata = diameter[26:40,])
qcc(diameter[1:25,], type = "S", newdata = diameter[26:40,])

detach(pistonrings)
qcc(diameter[1:25,], type = "xbar")qcc(diameter[1:25,], type = "R")qcc(diameter[1:25,], type = "S")qcc(diameter[1:25,], type = "xbar", newdata = diameter[26:40,])qcc(diameter[1:25,], type = "R", newdata = diameter[26:40,])qcc(diameter[1:25,], type = "S", newdata = diameter[26:40,])
Attribute data
data(orangejuice)
attach(orangejuice)
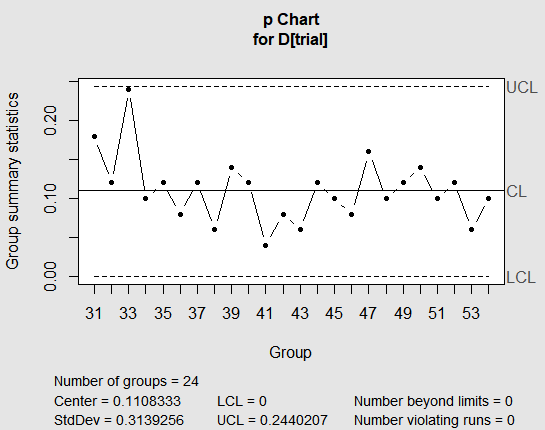
qcc(D[trial], sizes = size[trial], type = "p")
Call:
ewma(data = diameter[1:25, ], lambda = 0.2, nsigmas = 3)

ewma chart for diameter[1:25, ]

Summary of group statistics:
    Min.  1st Qu.   Median     Mean  3rd Qu.     Max.
73.99540 73.99900 74.00140 74.00296 74.00680 74.01920

Summary of group sample sizes:
  sizes  4  5
  counts 1 24

Number of groups:  25
Center of group statistics:  74.00298
Standard deviation:  0.01192384

Smoothing parameter: 0.2
Control limits:
         LCL      UCL
1   73.99978 74.00618
2   73.99889 74.00708
...
25  73.99702 74.00895
Call:
ewma(data = diameter[1:25, ], lambda = 0.2, nsigmas = 2.7, newdata = diameter[26:40,     ], plot = FALSE)

ewma chart for diameter[1:25, ]

Summary of group statistics:
    Min.  1st Qu.   Median     Mean  3rd Qu.     Max.
73.99540 73.99900 74.00140 74.00296 74.00680 74.01920

Summary of group sample sizes:
  sizes  4  5
  counts 1 24

Number of groups:  25
Center of group statistics:  74.00298
Standard deviation:  0.01192384

Summary of group statistics in diameter[26:40, ]:
    Min.  1st Qu.   Median     Mean  3rd Qu.     Max.
73.99000 73.99800 74.00275 74.00329 74.00832 74.02300

Summary of group sample sizes:

  sizes  2 3 4 5
  counts 1 3 2 9

Number of groups:  15

Smoothing parameter: 0.2
Control limits:
         LCL      UCL
1   74.00010 74.00586
2   73.99930 74.00667
...
40  73.99818 74.00778